
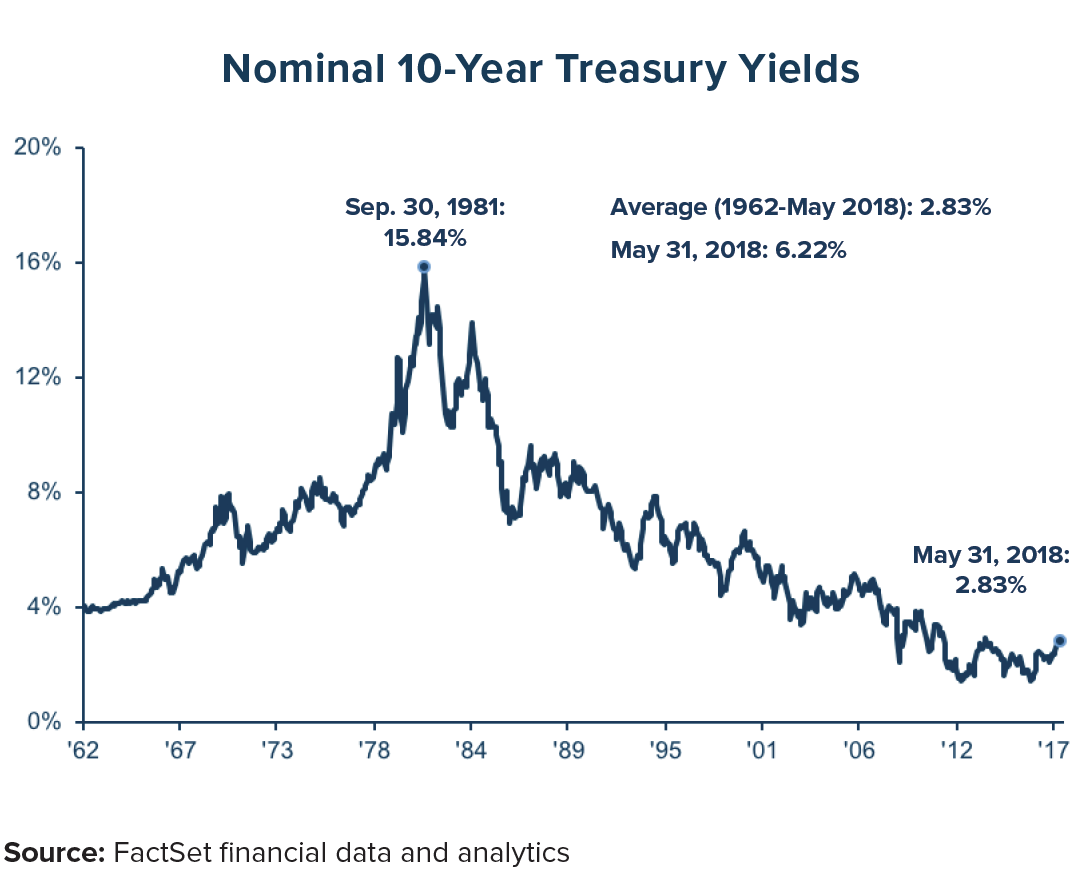
Change is in the air. After a 37-year bull market in U.S. Treasury Bonds that repeatedly probed new depths in yields, the 10-year U.S. Treasury bond yield hit a low of 1.36%1 in July 2017 before turning back up again. As of this writing (in June of 2018), it has climbed to around 3%2—a level last reached on December 31, 2013,3 during the so-called “Taper Tantrum,”4 the market reaction to the Fed’s announcement of an end to quantitative easing. Now, headlines are trumpeting rising bond yields, new moves by the Fed, and—interestingly—a flattening yield curve.
What, if anything, do these developments signal for the bond and equity markets? What effect will they have on investors? Could they be signaling a potential recession in the works?
What the yield curve is—and why investors should care
Bond yields and bond prices have an inverse relationship. As bond yields rise, bond prices tend to decrease, based on discounted fixed future interest payments and values at maturity. The reverse is also true: as yields fall, bond prices go up. 5
When investors talk about the yield curve, they are referring to the differences between interest rates at different maturities—such as 2 years, 10 years, and 30 years. Investors holding longer-maturity bonds expect higher interest rates, to compensate them for the risk of having to wait longer to receive par value and coupon payments. In general, investors view the longer end of the Treasury curve as a sign of market expectations for growth and inflation: if the market expects growth, then the long end of the curve should reflect higher interest rates.6 At the short end of the curve, the Federal Reserve has more influence. The Federal Open Market Committee (FOMC) controls the level of the federal funds rate—the interest rate at which depository institutions lend balances to each other and to the Federal Reserve overnight.7
When the economy is performing well, the long end of the yield curve—that is, instruments with longer maturities such as 10, 15 or 30 years in length—will be higher than the short end and also upward sloping (i.e., 15-year bonds should have higher rates than 10-year bonds), reflecting an expectation of positive growth. However, if the bond market loses faith in future growth, the yield curve will start flattening as longer maturities come down. When the bond market believes a recession is on the horizon, bond yields will invert: that is, 2-year Treasury bonds will seem safer, and have higher yields than 10-year Treasury bonds.
A tug-of-war between conflicting economic forces
The yield curve is flattening now. Does that signal a loss of confidence in future growth? Actually, while the yield curve is bending toward a slowdown, other forces are pulling the economy in the opposite direction. What we are witnessing now is, in our opinion, a tug-of-war between growth and potential recession.
We believe there are several positive signals for the economy. So far, first-quarter earnings for S&P 500 companies are up over 20%8 with contributions from a strong rebound in energy and other sectors. However, the S&P 500 index is only up +2% year-to-date (as of June 2018), and the price-to-earnings multiple is back to its historical average,9 suggesting the market may not be overvalued. Unemployment in the U.S. is only 3.9%, and companies are starting to spend more on capital expenditure projects. The tax reform from December 2017 is flowing through the economy as well.10
On the other hand, we are almost ten years into the bull market that started after the Great Financial Crisis (GFC) in 2008-2009,11 and some analysts believe we are in the later innings of the current business cycle.12 The Federal Reserve has stopped Quantitative Easing (QE) and is becoming more restrictive. Inflation is creeping back into the economy, with commodities appreciating since the beginning of the year.13
The flattening yield curve is trying to tell us something—but what? Does the market no longer believe in the growth story? Or does it fear that the Fed will overshoot in raising interest rates, and push the market into a recession?

Where the Fed is headed
Jerome Powell took over as Fed Chairman in February. Since then, he has telegraphed to the markets that the Fed will raise interest rates three or four times in 2018, and two or three times in 2019, while trying to achieve its dual mandate of full employment and 2% inflation.14 In March, the Federal Reserve raised the rate that it lends to banks by 0.25% to 1.75%.15 By year-end, that rate could hover around 2.25% to 2.50%. The Fed has stated that growth remains strong,16 raising potential concerns about inflation. To avoid the economy overheating, the Fed is gradually increasing the federal funds rate. We also suspect that the Fed is raising interest rates to amass some dry powder, so it can reduce rates when the economy eventually does take a turn.

A key signal to watch—and what it could really mean for investors
One way investors may be able to assess the health of the nation’s economy is by looking at the spread or difference in rates between the 10-year U.S. Treasury bond and the 2-year U.S. Treasury bond—the “2s/10s spread.” That spread has now dipped below 0.50%.17 If the spread turns negative, the inverted yield curve is typically seen as a leading indicator that the economy will enter a recession. 18
Is the yield curve warning us of an imminent recession now? A look at history may be instructive.
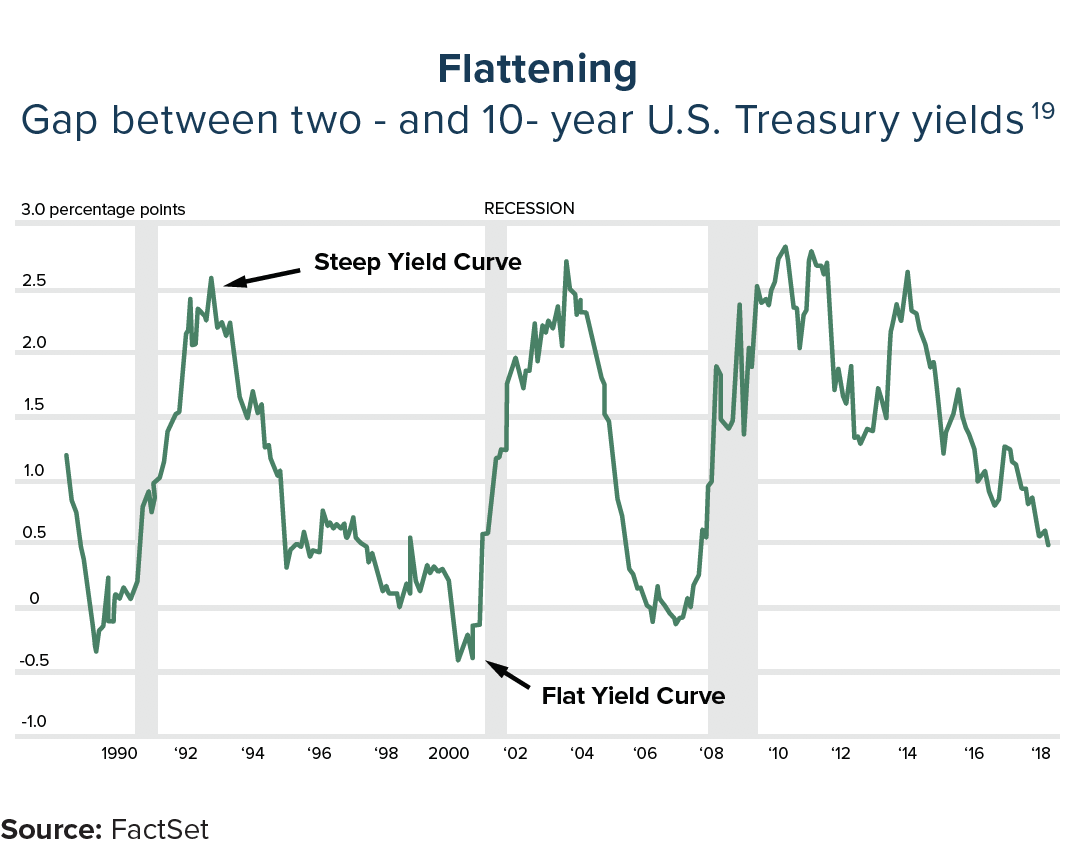
There have been nine recessions since 1954, and all were preceded by an inversion in the yield curve. There have also been four false signals, when the yield curve was inverted but no recession followed: 1965, 1967, 1971 and 1998.20 The average length of time between the yield curve inverting and the subsequent recession was 15 months. Therefore, even if the yield curve’s recent behavior truly were an early warning sign of a contraction ahead, we would still not expect an imminent recession. We are hardly alone in that opinion. A Wall Street Journal article noted that in a survey of economists showed that 59% of those surveyed expect the economy to enter a recession in 2020, while 21% foresee a contraction in 2021.21
More importantly, the yield curve is not a crystal ball. Interest rates and the yield curve reflect the market’s current expectations—but those expectations are constantly changing in reaction to headline news and changes in Fed policy. We could easily imagine scenarios in which the Fed pauses its rate hikes, inflation cools down, or company earnings continue to accelerate, all of which would provide a positive backdrop for stocks and a better, more stable rate environment for bonds.
Our market outlook
At Anchor, we strive to maintain a long-term view, searching for value opportunities across asset classes while also seeking to protect clients from downside risk.
At this point in the cycle, we believe that equities continue to be more attractive than bonds, given their favorable tailwinds as well as the impact of rising interest rates on bond prices. We also think it is a good time to continue using cash opportunistically to purchase attractive investments. The behavior yield curve may hint at a potential change in the weather on the horizon, but we think a recession is still years away.
click here to download a PDF of this article.