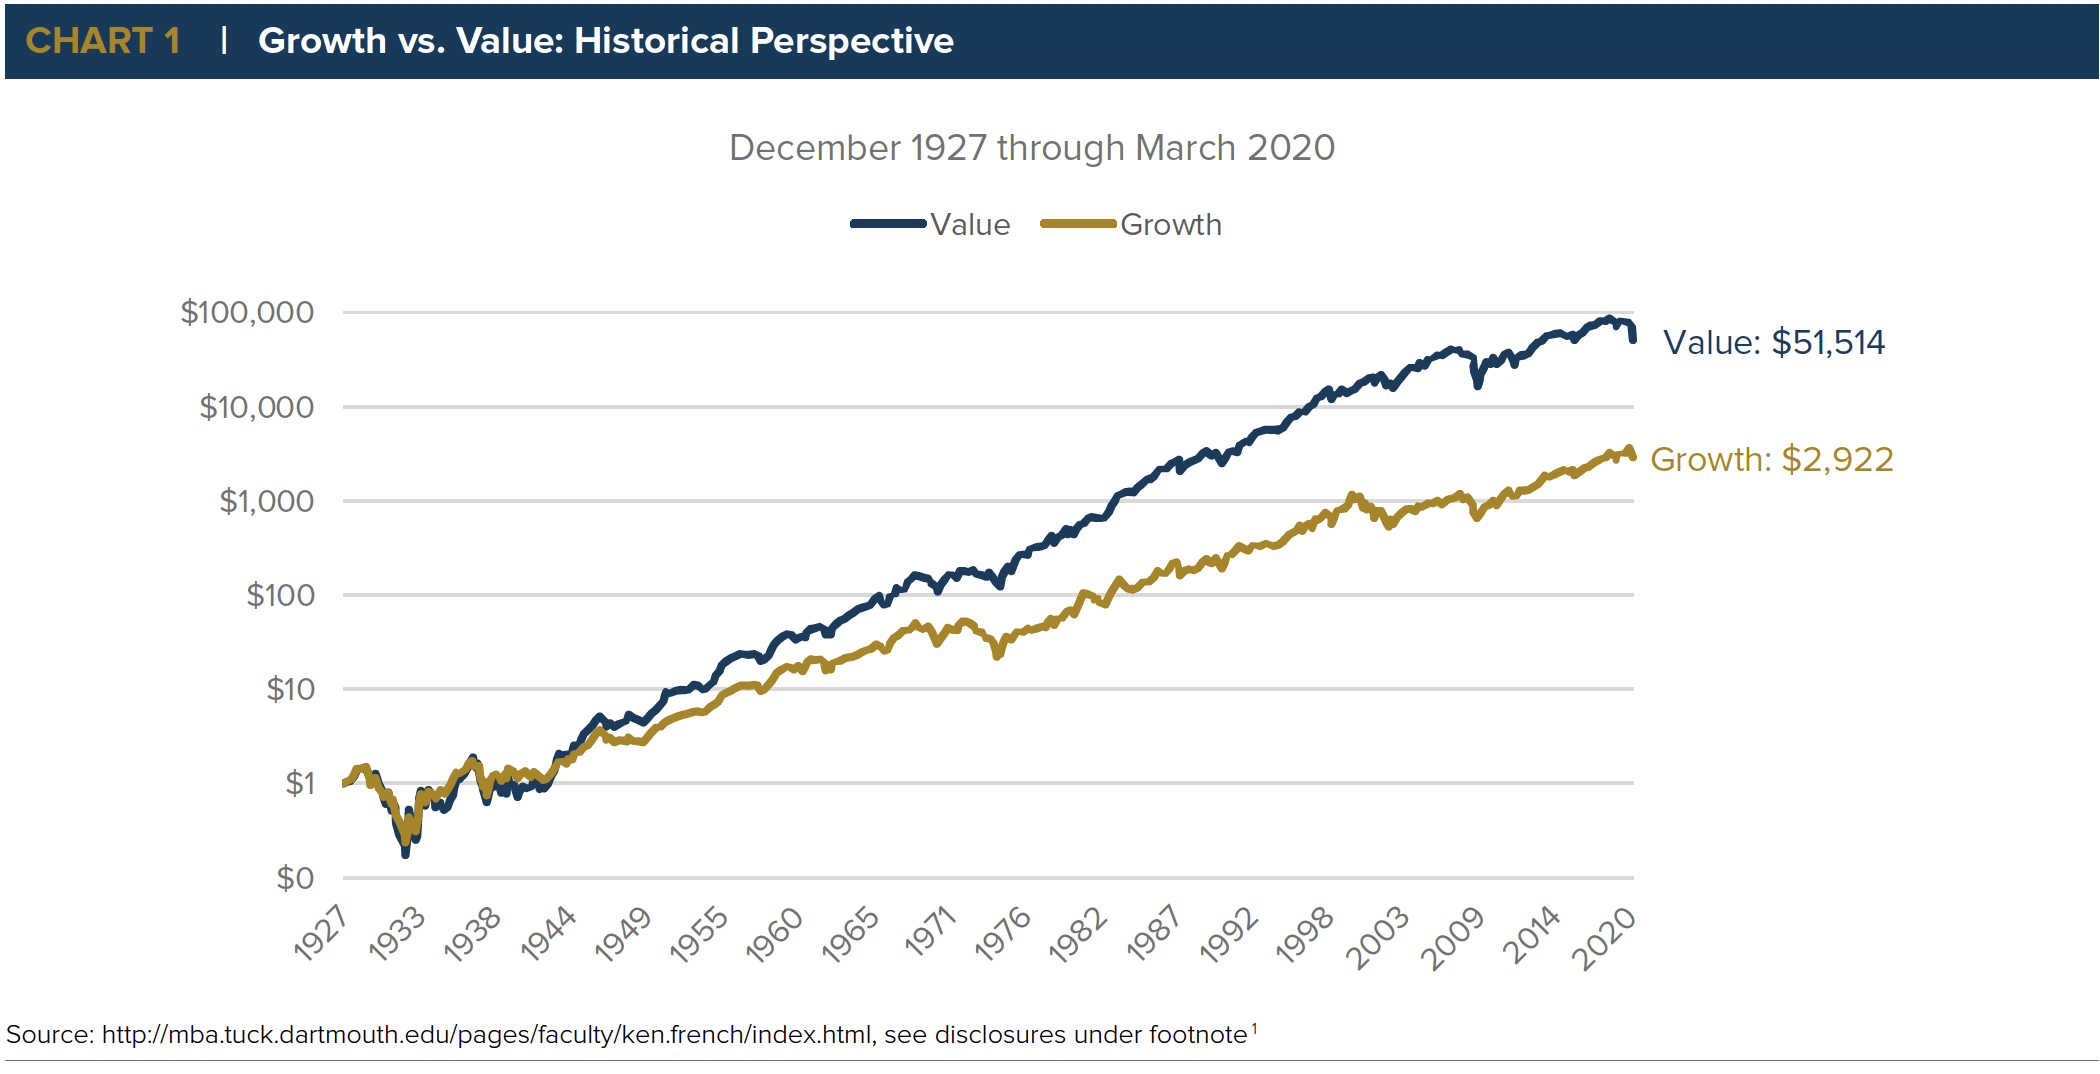
United States history is punctuated by a series of watershed moments that have shaped our nation’s history. The Roaring 1920s through The Great Depression, for example, saw the spectacular rise followed by the equally dramatic fall of the US stock market. World War II was followed by 20 years of worldwide economic growth through the early 1970s called The Golden Age of Capitalism. The 1970s oil crisis, the Tech Bubble of the 1990s, and the Global Financial Crisis of 2008 are all events that, for better or worse, were defining periods in history with far-reaching economic impacts. Through it all, value investing has long held a structural advantage over growth investing when considered over multiple market cycles. In fact, if one were to have invested $1 each in value and growth stocks in December 1927, the value investment would today be worth nearly 18 times the growth investment1. (See below, Chart 1)
Growth vs. Value: Benchmark Composition
Despite the overall advantage of value over multiple market cycles, since 2007 we have seen a trend of growth outperformance. Benchmark construction plays an important role in dissecting the current trend of growth outperformance overvalue. Russell style indices are constructed using a multi-variable approach that uses book-to-price and long-term growth estimates to determine style. Growth stocks are often characterized by companies with significant cash flows or earnings that seek to grow at a rate much greater than the overall market. They generally do not pay dividends, but rather reinvest earnings to accelerate growth. Value stocks are characterized by companies with solid fundamentals that are trading below their book value. They often share earnings with investors, through bull and bear markets. Growth stocks represent companies with future potential; value stocks represent companies that are undervalued. Applying this methodology, the technology sector is historically the largest weighted sector in the growth indices, whereas the financial services sector is the largest weight of the value indices.
This growth overweight in technology and underweight in financial services against its value counterpart are two of the most important factors of overall outperformance during the current market trend2. (See below, Chart 2)
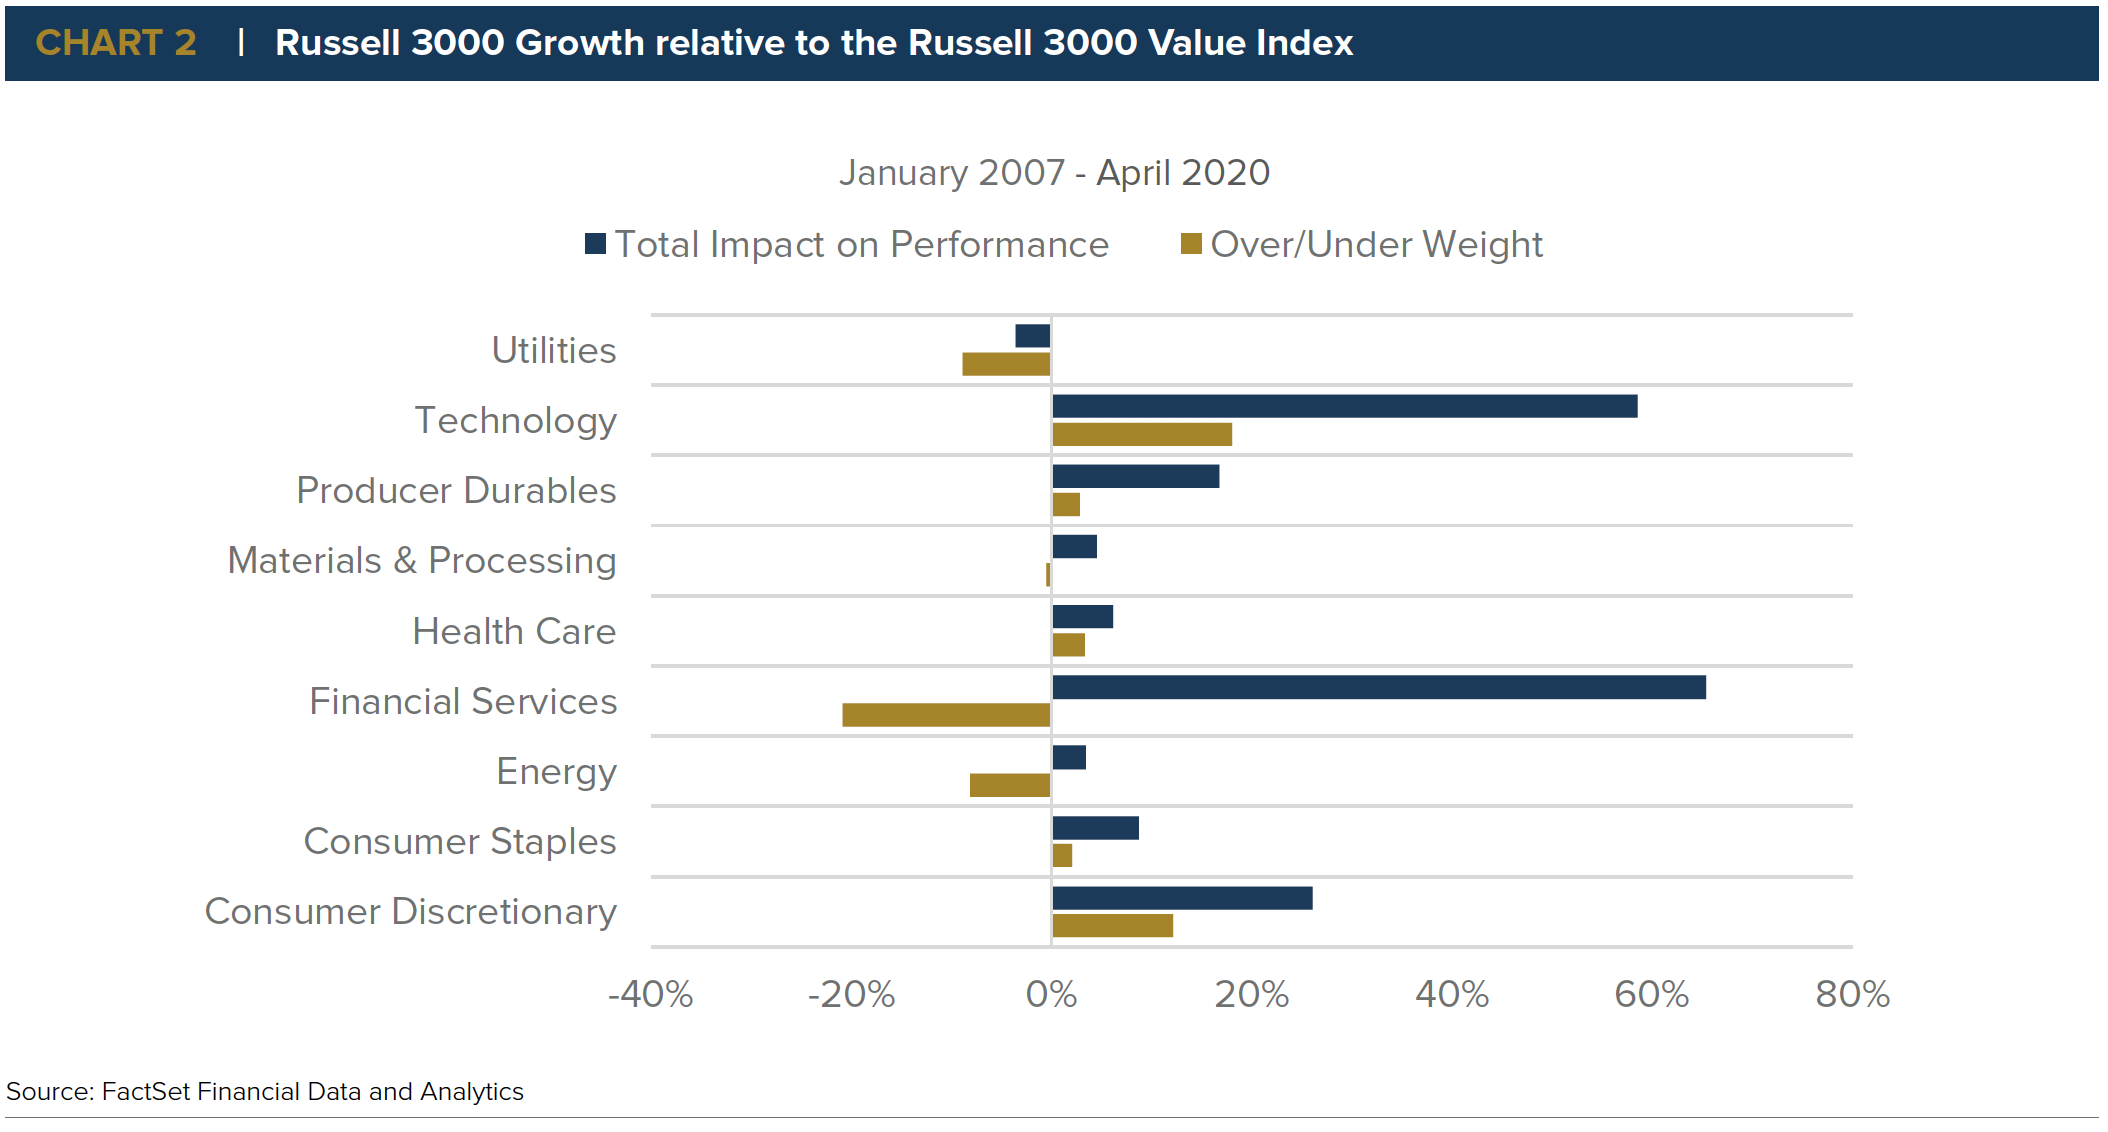
Since January 2007, the Russell 3000 Growth Index has maintained a 21% underweight in financial services relative to the Russell 3000 Value Index. This underweight, along with security performance, results in 6,500 basis points of outperformance (cumulative) for the financial services sector versus the Russell 3000 Value Index. The financial services sector was hit especially hard during the Global Financial Crisis of 2008, due to the bank failure during the crisis and the low-interest-rate environment that followed. Similarly, for the same period, the Russell 3000 Growth Index has maintained an 18% overweight in technology over the Russell 3000 Value Index. This overweight, along with security performance, generated 5,900 basis points of outperformance (cumulative) for the technology sector relative to the Russell 3000 Value Index. More recently, the number of unprofitable companies going public has surged to “tech bubble levels”, according to a report issued by Bank of America Merrill Lynch. The proportion of unprofitable companies going public, versus profitable companies, has reached 70%, the highest rate in 20 years (see the below, Chart 3)3.

This is noteworthy, as investors have begun to shy away from higher-risk ventures with no certain path to profitability3. We believe this trend could be problematic for many growth companies should we fall deeper into economic hardship.
Growth Cycle: 2006 to Present
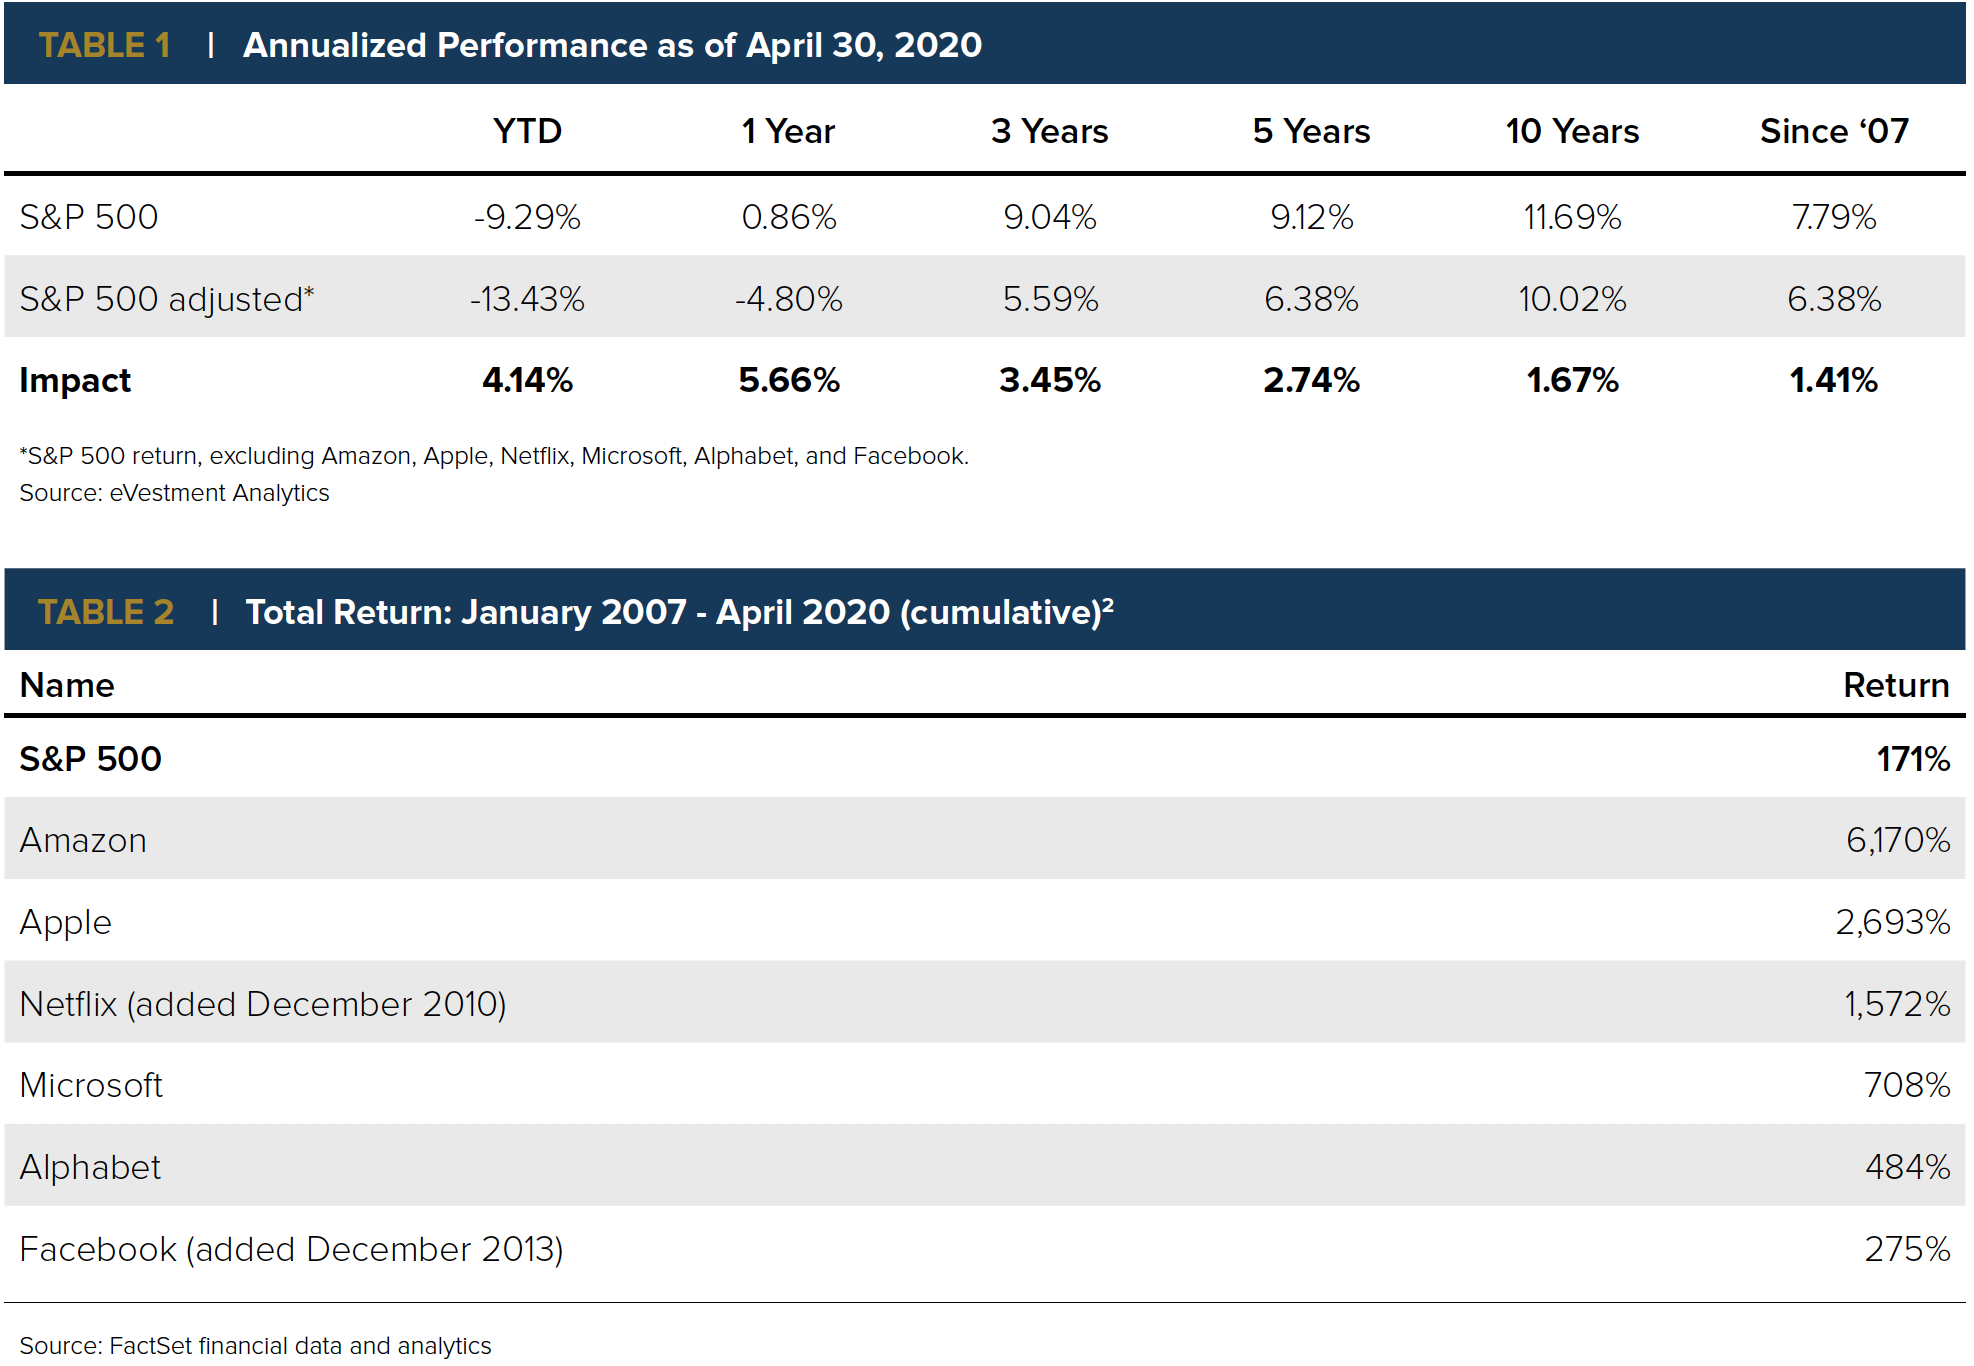
Our lives changed dramatically in the mid-to-late 2000s as technological innovations led to mainstream consumption. Amazon had become an enormous presence in online retail and a direct threat to traditional brick-and-mortar stores as the preferred method of shopping. Alphabet, led by Google and its advertising business model that quickly transformed into the world’s most popular search engine, averaged an annual sales growth rate of 30% per year for 15 years ending 12/31/192. Netflix introduced video streaming services in 2007 that effectively drove Blockbuster out of business, and has since become the market leader in digital streaming with 167 million subscribers worldwide at the end of 20194. Social-networking became prevalent as Facebook surpassed MySpace in popularity and, as of 2019, is the most popular social network site worldwide with 2.5 billion users5. Consumers were introduced to mainstream smartphone usage in 2007 with Apple’s release of iOS and the iPhone. Google countered with the launch of an open-sourced Linux-based mobile operating system called Android. The first commercial Android device, HTC’s G1, was launched in 2008 to compete directly with the iPhone. Apple and Google, along with other smartphone manufacturers using Android’s OS (Samsung, LG, Sony, HTC, etc.) would go on to compete globally in this growing smartphone arena, and still do today. Bill Gates, who a decade earlier took personal computers mainstream with the release of Windows 95, continued to position Microsoft as an elite industry leader with several OS releases, the development of the Xbox One gaming console, Outlook.com (to compete with Google’s Gmail), and Surface tablets. These six companies (Facebook, Alphabet, Amazon, Apple, Microsoft, and Netflix) represent 21% of the S&P 500 index as of April 30, 2020. The following table demonstrates just how impactful these six companies have been during this era6. (See below, Table 1 and Table 2)

Against this backdrop of innovation and competition, the duration and tenacity of the current growth performance cycle is as severe as any we have seen in history, exceeding those of the Dot.com bubble and those during the 1930s1.
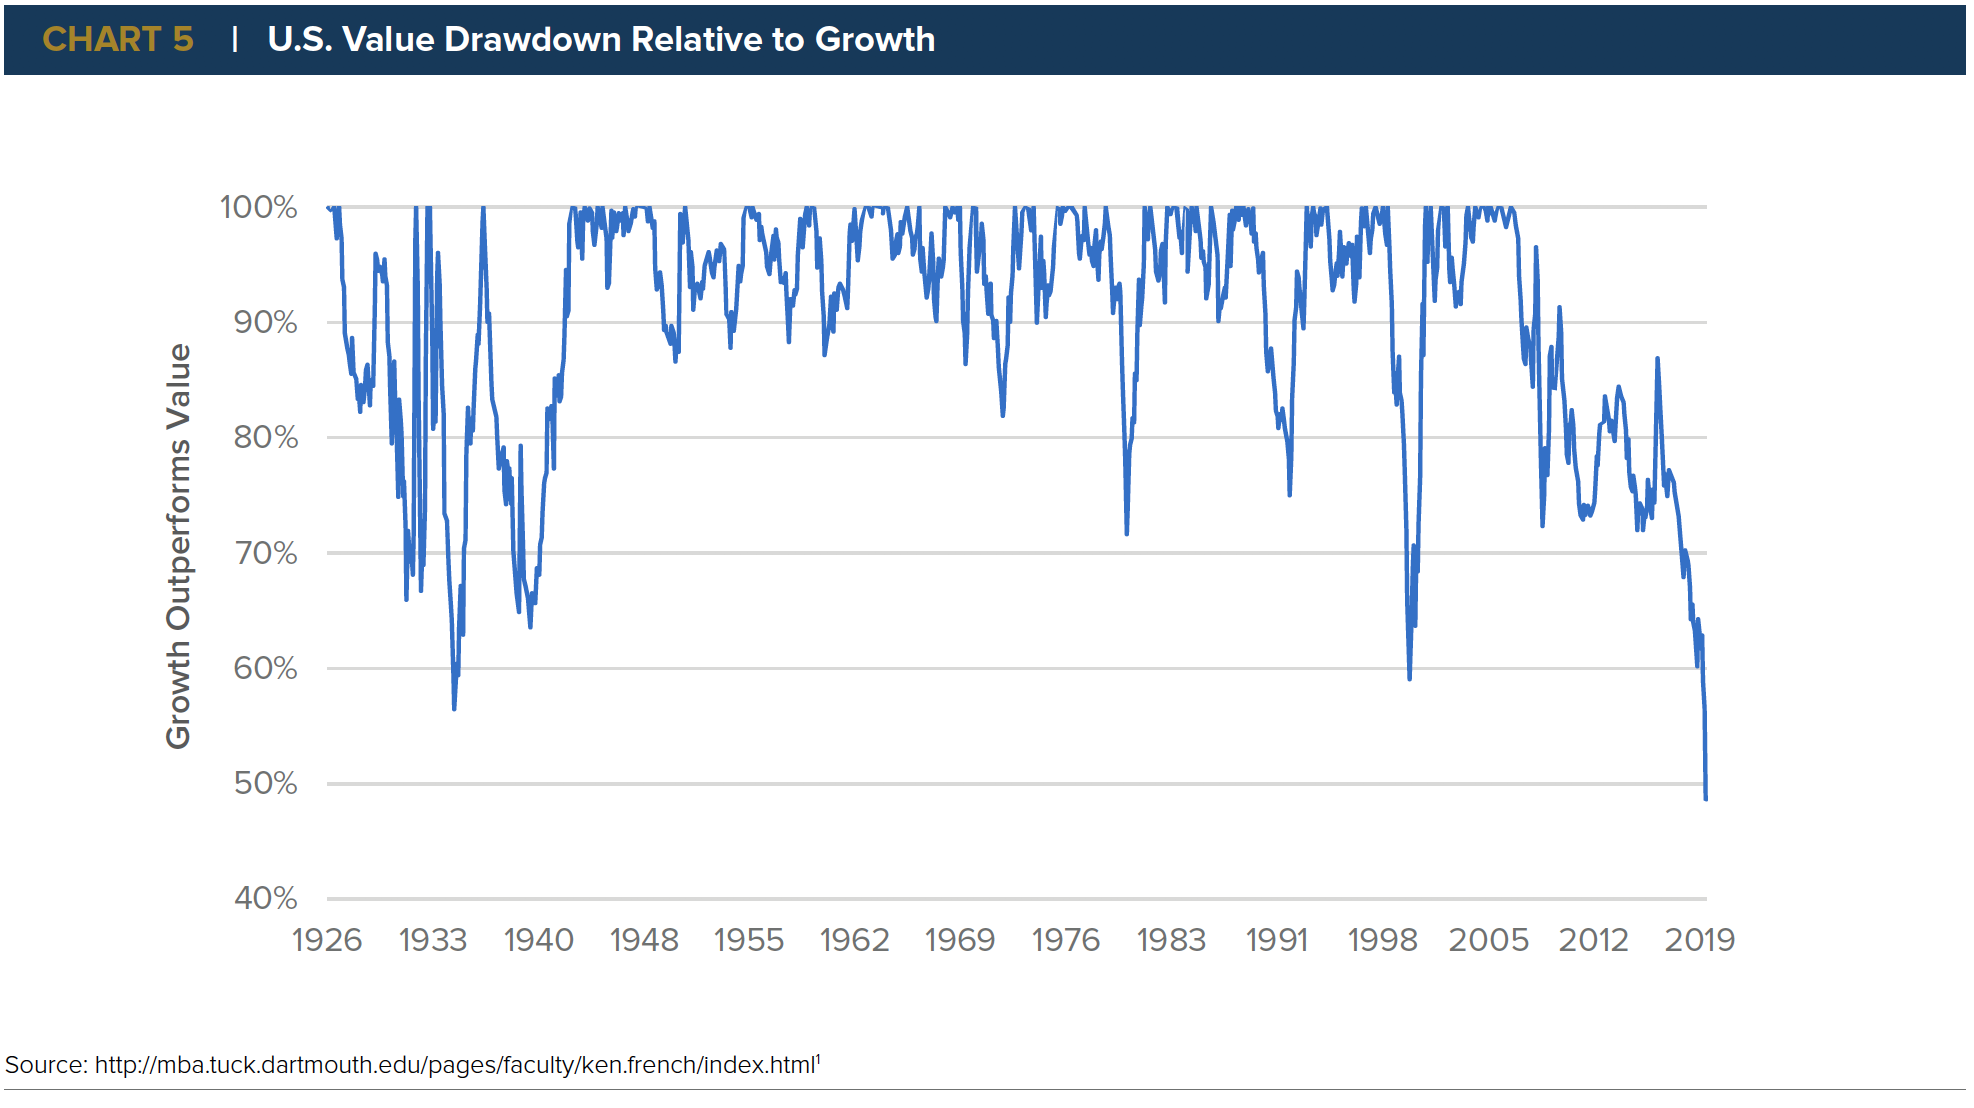
An examination of the largest drawdowns in history demonstrates that more recently, the recovery to the top has been much sharper than the length to bottom.
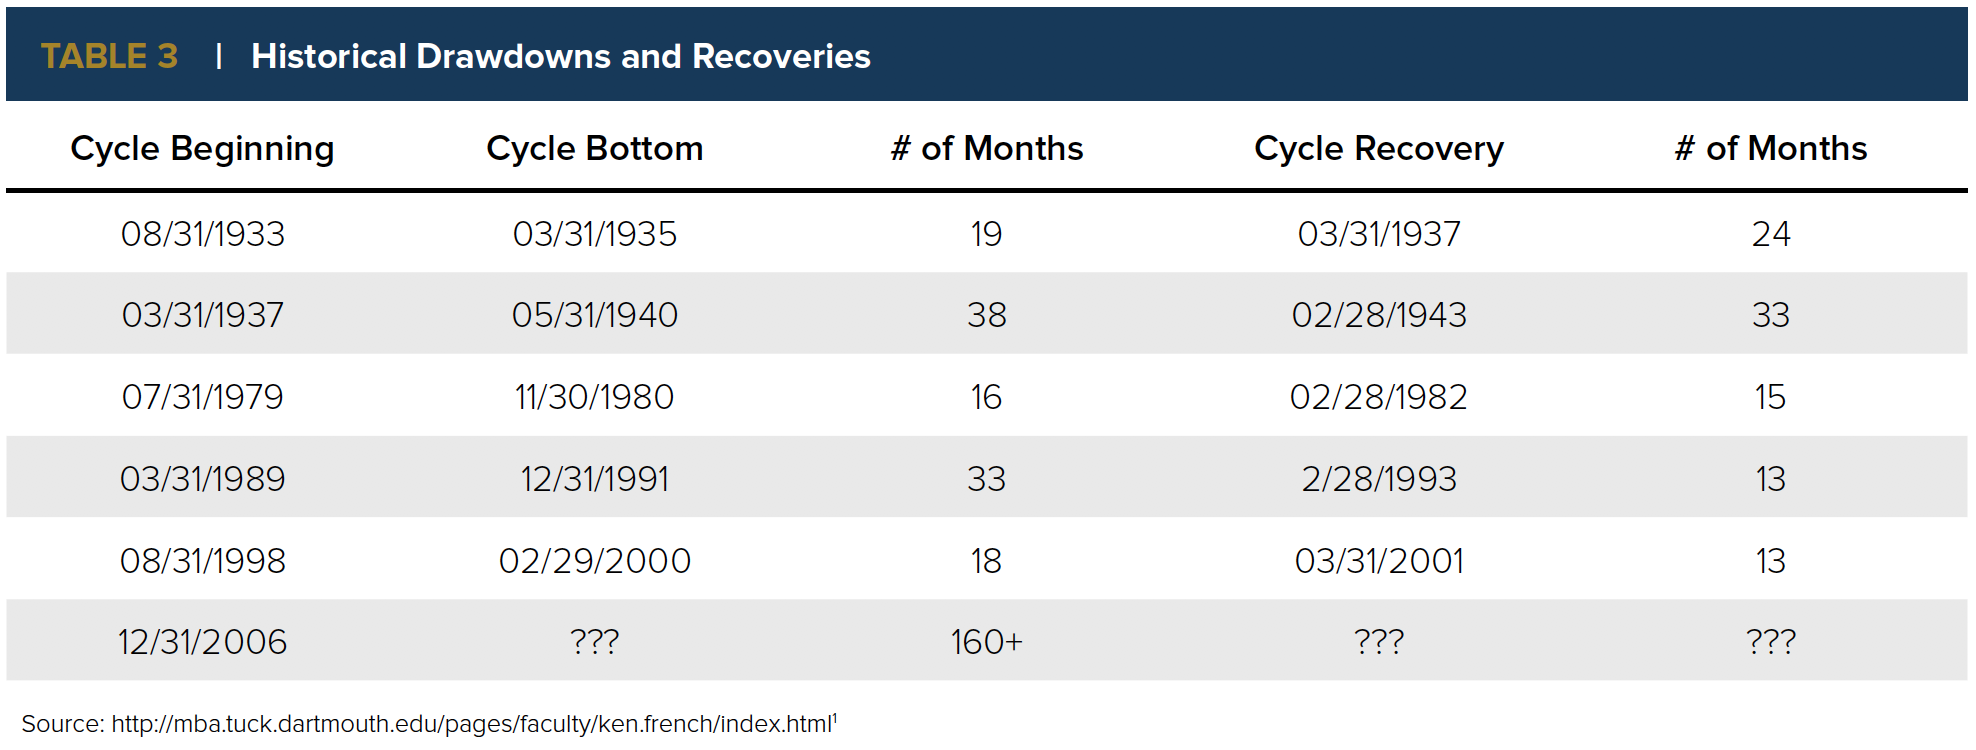
Unlike the Dot.com bubble of the late 1990s, which ultimately burst as many of the now-defunct start-up technology firms went bankrupt, the current cycle is characterized by the survivors of that era. These companies have thrived and have made an indelible mark on history. Most recently, technology is at the forefront again in the midst of the COVID-19 pandemic. People are using technology more than ever: to communicate with others, work from home, shop for groceries, and stream entertainment. We believe this is responsible for the accelerated growth trend during the first part of 2020.
The Aftermath
Thirteen years after Steve Jobs introduced the world to the iPhone many investors are wondering: will value investing ever shine again? Is it due for a comeback? If so, when will it begin? Human nature may question the relevance of value investing, given the growth cycle’s dominance since 2006. While the past decade and a half has treated us to an abundance of technology that has reshaped our lives, history demonstrates that value investing will thrive over time, and that even when out of favor, the importance of well-run companies with strong fundamentals is significant. The bull market from 1982 through 1999, widely considered one of the longest in history, was fueled by a value cycle that followed a period where stocks were acutely undervalued in the late 1970s and early 1980s. More recently, a sustained value investing cycle beginning in 2000 helped stabilize a financial market in turmoil after the Dot.com bubble burst in early 2000. There is no question that value investing has been out of favor the past decade; there is simply no debate. We do, however, feel strongly that a broad view of market cycles, coupled with a reflection on history, are powerful indicators that a comeback for value investing is imminent. We caution investors against underweighting value investments, especially now, as history has shown recovery continually follows periods of drawdown. We at Anchor feel it is more important than ever to stand our ground: with our fundamental value investing approach, we continue to deploy our time-tested process to build risk-controlled portfolios designed to outperform their benchmarks over full market cycles. We are proud of our heritage, confident with our positioning in the current market cycle, and look forward to participating in a sustained comeback for value investing.
To download this article, click here.
